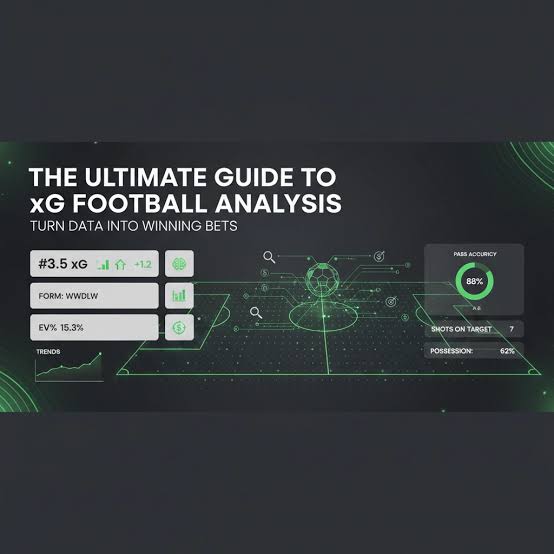
Traditional match metrics like raw shot counts, ball possession percentages, and final scorelines often distort a team’s true operational efficiency on the pitch. In the 2010/2011 La Liga campaign, extreme finisher quality and deep defensive low blocks created wide variances between actual results and underlying probability distributions. Applying Expected Goals (xG) and Expected Goals Against (xGA) metrics allows analysts to isolate chance creation quality from sheer luck, providing a clearer blueprint for identifying mispriced odds and anticipating regression trends across domestic leagues.
The Core Mechanics of Expected Goals in Football Modeling
Expected Goals measures the quality of a scoring opportunity by assigning a probability value between 0.00 and 1.00 to every shot taken, based on historical shot location, angle, body part, and assist type. When an analyst evaluates a team’s offensive output through xG rather than total shots, they eliminate the noise generated by low-probability attempts from outside the penalty box. A club attempting twenty long-range shots might accumulate an xG of merely 0.60, whereas a team crafting two open-goal tap-ins can easily exceed 1.50 xG.
Understanding xGA follows the exact same logical framework applied to defensive vulnerability. Expected Goals Against quantifies the quality of chances a team allows its opponents to generate during a match, regardless of whether those chances result in goals, saves, or wild misses. Dissecting the delta between actual goals conceded and xGA reveals whether a club’s clean sheet record stems from elite structural organizing or simply reflects poor finishing from opposing attackers.
Measuring Finish Efficiency Versus Systemic Chance Creation
Evaluating elite teams like Barcelona and Real Madrid during the 2010/2011 season highlights the necessity of distinguishing between tactical chance creation and world-class shot conversion. While both clubs consistently generated high baseline xG figures through dominant possession and quick transition schemes, individual finishing talent repeatedly pushed actual goal totals far past their expected metrics.
- Overperformance Duration: Elite individual finishers can sustain goal tallies above their xG baseline over an entire 38-game season due to exceptional shot placement ability.
- Systemic Sustainability: Mid-table teams experiencing a short-term surge in scoring without a corresponding rise in xG creation inevitably suffer a severe scoring drought once shot conversion normalizes.
- Defensive Variance Drivers: Extraordinary goalkeeper performance can suppress a team’s actual goals conceded well below their xGA, masking underlying structural leaks in central defense.
- Game-State Distortion Effects: Early goals alter team behavior, causing leading favorites to intentionally drop their pressing volume, which artificially caps late-game xG accumulation.
Recognizing these operational drivers prevents analysts from misinterpreting statistical variance as permanent team quality. When a mid-tier club overperforms its xG by a large margin over five consecutive weeks, public markets routinely overprice their upcoming match odds, creating prime opportunities for disciplined analysts to fade them.
Identifying Regression Candidates Through Underlying Differentials
The primary practical application of xG and xGA lies in spotting team performance regression before public perception and bookmaker lines adjust. A team accumulating points through unsustainably high conversion rates on low-quality chances will eventually experience a downward trend in results once those low-probability shots stop finding the back of the net.
When evaluating team performance splits, เว็บยูฟ่า168 expected metrics alongside actual goal totals uncovers structural discrepancies that standard standings obscure completely.
| Team Profile Type | Actual Net Goal Differential | Expected Net Differential (xG – xGA) | Market Perception Status | Expected Short-Term Performance Shift |
| Overperforming Luck-Beneficiary | +12 | +1.5 | Heavily Overvalued | Negative Result Regression |
| Dominant Elite Baseline | +45 | +41.0 | Accurately Priced | Sustained Top-Tier Output |
| Underperforming Unlucky Side | -8 | +3.2 | Severely Undervalued | Positive Result Regression |
| Structurally Defective Low-Block | -18 | -22.5 | Accurately Faded | Continued Low-Margin Struggle |
The empirical relationship mapped above proves that underlying chance creation metrics serve as a reliable leading indicator for future performance. Teams exhibiting a positive expected net differential despite a negative actual goal differential represent high-value targets for handicap coverage, as their core process is functioning efficiently despite short-term finishing bad luck.
Evaluating Asian Handicap Lines with xG Volatility
Asian Handicap lines in top-heavy domestic leagues require precise evaluation of expected goal margins rather than binary win-loss probabilities. If a heavy favorite carries a handicap line of -2.25 goals, their historical xG generation against low-block defenses must demonstrate a consistent ability to generate over 3.00 xG to justify taking the spread risk.
Observing live market behavior when a favorite dominates the xG battle but remains tied at half-time reveals significant pricing friction. Bettors analyzing matches through a sports betting service can spot instances where live handicap lines drop dramatically due to a goalless scoreline, even though the dominant side has already accumulated 2.10 xG and maintains total structural control.
Assessing Over/Under Goal Totals using Cumulative xG Metrics
Goal total markets frequently overreact to recent high-scoring matches without considering whether those scores were driven by high chance quality or defensive blunders. Combining the home team’s home xG and xGA with the visiting team’s away xG and xGA creates a baseline projection for expected match total volume.
Goal Line Evaluation via Expected Chance Volume
Analyzing match conditions requires determining whether tactical setups will produce open, high-xG environments or tight, low-chance physical battles.
[High Combined xG + High xGA] —> [Frequent High-Quality Transitions] —> [Expected Total Exceeds 3.0] —> [Over Line Value]
[Low Combined xG + Low xGA] —> [Compact Mid-Block Disruption] —> [Expected Total Below 2.0] —> [Under Line Value]
When two teams with low individual xG generation face each other, public sentiment often expects goals simply because both sides possess poor defensive records. However, if their combined xGA stems from occasional individual errors rather than high shot volumes allowed, the match frequently settles into a slow, low-xG battle that stays comfortably under standard total goal lines.
Defensive Resilience and xGA Distortion in Hostile Stadiums
Away teams playing in intimidating venues like Bilbao’s San Mamés during 2010/2011 often conceded high xGA numbers due to sustained home pressure and elevated box entry counts. However, defensively structured visiting sides that forced opponents into taking contested, high-density shots kept individual shot values extremely low.
Should an analyst evaluate away team resilience, isolating shot location data from total shot suppression becomes essential. An away team allowing fifteen shots from outside the box may show a rising shot-against counter, but their total xGA remains low because the opposition is denied clean looks on goal.
Integrating Advanced Data into Betting Platforms and Workflows
Modern odds pricing engines incorporate advanced telemetry and tracking data to establish opening lines, meaning simple past-performance metrics no longer offer a competitive edge. To find value, analysts must combine underlying xG profiles with situational context like player injuries and fixture density.
Analyzing live line fluctuations via a casino online website enables observant analysts to track when public money pushes market odds away from underlying statistical realities. Capitalizing on these public overreactions requires identifying fixtures where the public backs a high-profile name coming off a lucky win, leaving the analytically sound side at inflated, attractive odds.
Failure Scenarios of Purely Statistical xG Models
While Expected Goals provides exceptional analytical depth, relying blindly on automated xG models without accounting for human variables creates severe analytical failure points. xG models typically treat shot takers as average players, failing to account for the extraordinary finishing efficiency of elite attackers who consistently convert 0.05 xG chances into goals.
Another critical model failure occurs when evaluating matches affected by early red cards or extreme weather conditions. A red card completely alters team space, forcing the depleted team into a survival block that destroys their offensive xG output while artificially inflating the opponent’s possession and chance quality metrics beyond their normal operational baseline.
Summary
Analyzing the 2010/2011 La Liga season through xG and xGA metrics proves that underlying chance creation quality offers far superior predictive power than raw scorelines and surface-level team rankings. By separating finishing talent and short-term variance from systemic chance generation, analysts can accurately forecast team regression and spot mispriced match lines. Whether evaluating deep Asian Handicaps, setting goal total thresholds, or timing live market entries, grounding decisions in expected performance metrics provides a structured, logical framework for evaluating high-level football.